Wednesday, June 1, 2016

MFT-4223 Encryption algorithm or key length is restricted under the java policy

If you are handling encrypted files with MFT, encryption algorithms/strength of public keys (key sizes) are critical components which require attention from a security standpoint. Algorithms such as RSA, DSA etc  and  keys with lengths greater than 2048 bits are usually considered secure. 

MFT 12c provides command line tools to generate PGP key pair, however as per Oracle MFT documentation,

“Our PGP generation tool is basic and intended for development. For production, you should generate PGP key pairs externally using some other tools and import it in MFT. By Default the PGP Generator of MFT uses the Bouncy Castle API with hard coded parameters, i.e 1024 Bytes, Expiry Date as Unlimited. The MFT PGP Generator has very limited functionality.”

So if you are using PGP keys generated from an external tool with key sizes 2048/4096 bits there is a likelihood that your MFT transfer (decryption pre processing action) has failed with below exception

Cause
Encryption algorithm or key length is restricted.
Action
Make sure algorithms and key used is not restricted under java security policy.
Error Description
MFTException [threadName=JCA-work-instance:JMSAdapter-7, errorID=3e8d5a86-a2db-4a80-b548-00c0edb4a37c, errorDesc=MFT-4223_Encryption algorithm or key length is restricted under the java policy., cause=Illegal key size or default parameters

 In order to get rid of this exception, you will have to follow below steps:

Tuesday, May 17, 2016

A look at Oracle SOA Cloud Service

Oracle has been rapidly moving most of their products to the Cloud and offering them under 3 broad categories of SaaS, PaaS and IaaS. One of the PaaS offerings is the SOA Cloud service. This pretty much provides most of Oracle's on-premise middleware products like SOA Suite, OSB, MFT, B2B, Technology adapters and API Manager on the cloud. 

PS: Oracle ICS, the other integration offering on cloud is slightly different from SOA CS in terms of its positioning as an iPaaS offering from Oracle (similar to Dell Boomi, Mulesoft and other pure play iPaaS products). 

But with ICS and SOA CS, Oracle has definitely offered various hybrid cloud solutions to customers. Below diagram shows various ways in which integrations can happen between SaaS applications and On-Premise applications using either ICS/SOA CS or using both.


Some of the key advantages of using SOA CS are:
  • Drastic reduction in provisioning time for SOA environments. 
    • In a typical IT environment, in order to setup a simple clustered SOA environment we need days or maybe weeks . The process starts with procuring the hardware, necessary software (+patches), installing and configuring the software. 
    • SOA CS eliminates all of the above by providing self-provisioning tools which can be filled by developers/architects. We just need to have the right subscriptions in place for the Storage, DB, Compute and Platform services as pre-requisite. A simple clustered SOA environment can be up and running within few hours using SOA CS.
  • Infrastructure worries handled by Oracle
    • No longer OS admins/Sys admins/Network admins/DBAs are required to setup infrastructure before developers can get a working environment. 
    • All infrastructure worries handled by Oracle including patching, backup/recovery etc
  • Faster time to market
    • Since environments (single node/cluster) can be provisioned quickly, the focus of the IT team is on developing integrations rather than worrying about the underlying platform's maintenance.
  • Cost Savings
    • The most obvious advantage with all the above is significant cost savings for customers as subscription costs for pay-per-use PaaS offerings is far lesser than the cost of owning and maintaining your own infrastructure in-house.
  • Gateway to Cloud
    • Large enterprise which have made significant investments over the years on their on-premise architecture will take time to adopt cloud. SOA CS is a way for them to gradually move their middleware platform to the cloud and adopt a hybrid solution in the meantime i.e combination of cloud and on-premise.

    In the below section I would like to cover the steps to setup a 2 node SOA+OSB cluster using SOA CS. 

    Step1: Get the required subscriptions for the PaaS offerings. I requested for a 30 day trial of Java Cloud service (cloud.oracle.com) which when approved by Oracle comes with below services.

    Step2: Configure the Storage cloud service and create the necessary storage containers for backup purpose. (SOA CS requires underlying DB CS which in turn requires Storage CS for backup/recovery). You can use the Cloudberry tool for OpenStack storage for connecting to StorageCS and creating the containers. The other option is to use Curl to invoke REST APIs for doing same task.


    Step3: Use Puttygen.exe tool for creating a pair of SSH Public/Private key pair which will be used for the creation of DBCS and SOACS instances.

    Step4: Configure the DBCS to create an instance of database which will be used by SOA CS for creating the RCU schemas of SOAInfra etc.


    I have shown backup destination as none below, but SOA CS requires that DB should have backup destination set to "Both Cloud Storage and Local Storage". So set up your DB accordingly by specifying the storage container details. I created a 2nd one named subsdb1 which I have used for SOA CS configuration.


    As you can see there is an hour glass icon next to the DB instance name, basically it takes around 30-40 minutes for the DB to be configured and be ready for use. You can keep track of status by clicking on instance name and looking at the provisioning messages in next page. Once active the hour glass icon will be removed.


    Step5: Finally we can configure the SOA CS instance using above details of Storage CS and DB CS.


    Once the SOA CS instance is created it takes about 1.5 to 2 hours for the instance to be ready for use. Again you can track the status in between along with % completion.


    After the SOA CS is active, you should see the service consoles getting ready for use. Deployment of code into the SOA CS and other console usage is similar to what we do on premise. No changes there.


    And that's it. Entire environment provisioning was done on Cloud console with minimal backend work and you have a running SOA+OSB cluster ready in just few hours.

    Tuesday, August 25, 2015

    Sending Error Notifications in MFT 12c

    Oracle SOA Suite 12c introduced a new product called Managed File Transfer (MFT). Basically MFT is a centralized file transfer solution for enterprises which addresses several pain points wrt. file transfers
    • It provides secure access to file transfers, tracking each and every step of the end to end file transmission.
    • Easy to use UI for designing, monitoring and administering the file transfer solution which can be used by non-technical staff as well
    • Extensive reporting capability with detailed status tracking and options to resubmit failed transfers. 
    • Built-in support for many pre and post processing actions like compression/decompression, encryption/decryption(PGP etc.) which in turn means no need to write custom code for these actions.
    • Out of the box support for many technologies including SOA and OSB which in turn leads to multiple integration pattern possibilities. Example: for a large payload processing MFT can simply consume the source file and pass it as a reference to SOA target for chunk read and transformation.
    • Integration with ESS (Enterprise Scheduler Service) which is another new product feature in 12c allowing to create flexible schedules for the file transfers without having to write any custom code (quartz, control M scripts, cronjobs etc).

    Even though the centralized monitoring dashboard in MFT console is robust and provides granular details of each phase of file transfer (eg: if the target systems are SOA it has embedded links to the EM Console for tracing the status there as well.) there maybe a need to send out email alerts for reporting file transfer failures to a support distribution list in a typical production environment (cannot expect people to keep monitoring the dashboard all the time).

    Below are high level steps to enable email notifications in MFT 12c.

    Step1:
    Run the below WLST commands in sequence to enable the event and add contact for email notification: 
    o   cd ${MW_HOME}/mft/common/bin
    o   ./wlst.sh
    o   connect("weblogic","xxxx","t3://hostname:port")
    o   updateEvent('RUNTIME_ERROR_EVENT', true)
    o   createContact('Email', 'abc@xyz.com' )
    o   addContactToNotification('RUNTIME_ERROR_EVENT', 'Email', 'abc@xyz.com')
    o   disconnect()
    o   exit()

    Step2: 
    Configure the Email Driver for notifications. Basically set the Outgoing Mail Server and the port (mandatory ones)


     You have to restart the MFT managed server after changing these settings.

    Step3: 
    Try replicating a file transfer error and monitor the error both in Monitoring Dashboard as well as check for the error email in outlook.


    NOTE:

    If event listed above is not enabled or no contacts are specified, then notification messages are sent to JMS “MFTExceptionQueue”. 

    Description: cid:image007.jpg@01D0DE76.5CC3AFE0

    Friday, August 21, 2015

    SOA Governance in 12c: OER vs. OAC

    As important it is for an enterprise to move towards Service Oriented Architecture to bring the necessary agility to its business, equally important it becomes for it to implement a SOA Governance Framework. Services left ungoverned lead to redundancy/duplication, non-standards based development and faster time to market. SOA Governance controls the service lifecycle right from inception, design, build till the decommissioning of service. It helps increase service re-use and also provides tools/reports for tracking the usage of services across enterprise thereby provide an accurate measure of the ROI.

    Oracle's 12c fusion middleware stack provides two SOA Governance products:

    • Oracle Enterprise Repository (OER)
    • Oracle API Catalog (OAC)
    OER provides robust design-time as well as run-time governance support for the service lifecycle, enabling storage and management of extensible metadata for composites, service, business processes and other IT related artifacts.

    OAC on the other hand is a lightweight SOA governance tool, allowing you to build a catalog of your enterprise's APIs. It provides a simplified metadata model for API assets along with easy search capabilities on the console.

    I won't be covering in-depth details about each product as there are some great content regarding that online like In-Depth look of API Catalog 12c. Having evaluated both products what I intent to do with this blogspot is to try and do a feature comparison between the 2 products in the important areas. Hope this gives a high level overview of the features available as well as helps in making right decision of choosing the correct tool.

    User-Role Mapping
    OER :
    There are several roles available in OER and based on the organization need all of these roles can be leveraged at various phases of the Service Lifecycle. The OER Admin screen provides the ability to control the Access setting for each of this role. The primary role for reviewing/approving assets is Registrar. Apart from that we have User role which has read only privilege, project architects/advanced submitters who can edit the asset, there are several administrator roles which can perform different level of admin tasks (granular segregation of duties).


    OAC:
        OAC has a simplified role structure with just 3 roles available for various functions. 
        Developer – Can search APIs (SOAP/REST) and use those, 
        Curator – Reviews API, can edit API to enrich it with additional metadata, Publishes the API
        Admin – Can harvest the API from command line and perform other admin tasks.


    Projects-Departments
    OER :
    Projects are the primary means of gathering metrics in OER. OER tracks assets produced by projects, as well as assets consumed by projects. In order for a user to access any files associated with assets in OER, the user must be assigned to a project. Both Users and Projects are assigned to Departments. This is convenient from a reporting standpoint, as organizations can then track the production and consumption of reusable assets to a specific department. OER allows creation of both projects and departments apart from the Default Department and Common Project.

    OAC:
    OAC doesn't allow creation of custom projects and all API assets are published/tracked under default "Common Project". It however allows creation of custom Departments.
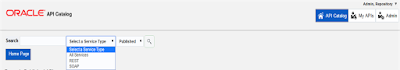
    Asset Data Model
    OER :
    OER provides a base set of data and option to import harvester solution pack which includes asset types specific for SOA artifacts (BPEL/OSB). Most of the SOA code artifacts when harvested get mapped to one of these asset types underneath. Example: a SCA project upon harvesting will create several OER assets like Composite, Business Process:BPEL, ComponentType, XSD, XSLT, WSDL, JCA, FaultPolicies , Adapter, Interface, Endpoint, Service etc.


    There is also an option to create custom Asset types if the need arises. For example: we can create document artifacts to capture Requirements Spec, Technical Design Document etc. to map to various stages of the Service Lifecycle (SDLC).


    OAC:
    OAC follows a simplified meta data model for the API assets. It classifies the API assets as either REST or SOAP and every code artifact harvested (BPEL or OSB) get categorized into either of this service type as shown below.

    Also OAC doesn’t provide an option to create any other custom asset type from the console/command line.


    Asset Approval Workflow
    OER :
    Each phase of service lifecycle has assets which follow the various states as they move through the Governance approval workflow.

    Basically asset harvested from command line/console goes to submitted-pending review state. Once the Registrar Accepts and Approves it upon reviewing, it moves to the submitted-under review state. As further approval happens and finally Registrar Registers it the asset state moves to Registered state. Only Registered assets are available for consumption to Users/Developers.


    OAC:
    OAC follows a simplified approval workflow for the API assets. Every API asset harvested from command line is in Draft state in OAC. The Curator will login to OAC and can review the asset, edit it with additional metadata or documentation and finally change the API status to Published. Only published APIs are available for consumption to Developers.
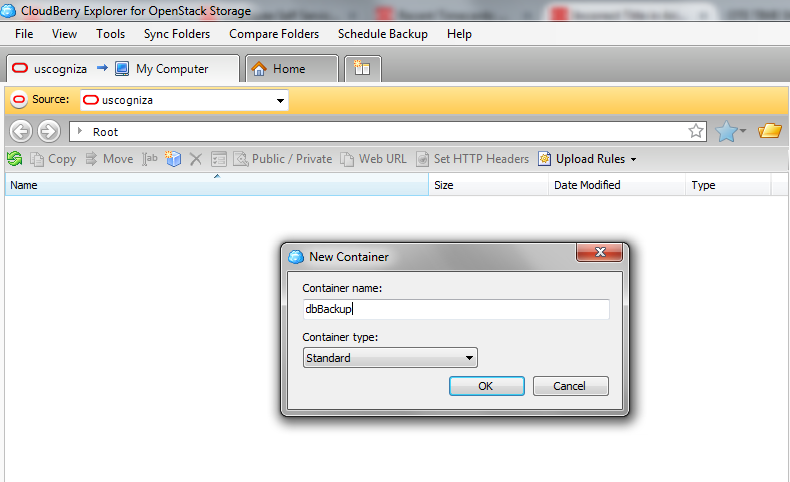


    Harvesting Assets
    OER :
    OER allows asset submission/harvesting from both OER console as well as command line tool.

    From command line, we need to edit the HarvesterSettings.xml file to ensure OER connection credentials and SOA/OSB project details are specified correctly and then execute either harvester.sh for SOA or osb-harvester.sh for OSB artifacts.


    OAC :
    OAC doesn’t allow any harvesting from its Console. You can however use the same harvester scripts of OER to do command line harvesting for API assets into OAC.

    NOTE:  Both OAC and OER use the same installer and command line tools.


    System Settings
    OER :
    OER Admin screen provides a great set of administration tools, covering lot of areas like Reporting, Notifications, SFID for usage tracking, LDAP/SSO integrations, Policy Management etc.


    OAC:
    OAC Admin screen has comparatively limited set of administration functions with no support for Notification Emails or Reporting. However you do have support for LDAP/Active Directory integration.


    Usage Tracking & Reporting
    OER :
    You can either use the OER Console to Use-Download an asset and its usage gets tracked against corresponding project. It prompts you to select the project on screen.


    The other way to consume an asset is from Jdeveloper/IDE by downloading the OER plugin. Once you enable SFID, the automated usage tracking is detected by OER.


    OER provides out-of-the-box reports which can be used for measuring the overall productivity of project teams, show the quality, status, and value of the asset portfolio. This requires a separate installation and integration with Oracle BI Publisher 11g as the reports get rendered in BIP.


    OAC:
    OAC also provides similar options to track usage of API assets from console as well as Jdeveloper. From console the Developer has to click on link Add to MyAPI for the tracking to begin for any Published API asset.

    However there is no Reporting feature available in OAC.


    Monday, April 20, 2015

    Service Monitoring in SOA 11g: Using Oracle BTM 12c

    Oracle Business Transaction Management (OBTM) is a Service monitoring tool for Oracle SOA environments. Oracle acquired it from Amber point and has rebranded it along with adding serveral functionalities to make it compatible with the Oracle FMW stack.  Oracle Enterprise Manager (OEM) which provides Server Monitoring capabilities can be used with BTM to provide an end to end Monitoring Capability at Enterprise level.

    SOA developers usually rely on either the EM console for monitoring/debugging SOA instances or Oracle Service Bus console (if reporting is enabled) for Service bus flows or log files incase of java components. If the landscape contains all these several components tied together it becomes a nightmare for people supporting/maintaining the system to debug it. 

    BTM comes handy in these scenarios:
    • It's a centralized service monitoring tool which gives lot of insights into service transactions.
    • It allows Automatic data collection through BTM Observers, which are non-intrusive in nature (unlike BAM it doesn't require any modifications to existing service code) 
    • It provides an end to end visibility to a service transaction spanning different type of components. (BPEL processes + OSB flows + Java web services+ Database calls etc.)
     At the time of writing this article, I have used SOA Suite/OSB 11.1.1.7 with BTM 12.1.0.6.7 on a 11g R2 DB. I won't cover the various installation/configuration steps for setting up the tool as its well documented in below Oracle link.


    I would like to touch upon some of the features the tool provides and a typical topology which will be used in most SOA deployments.

    Service Endpoint Monitoring
    By default the BTM observers will monitor most of the service end points like BPEL endpoints, OSB Proxy endpoints or Business Services, database adapter calls (create connection, close connection, execute etc), POJOs, JMS queues etc. Even without any transaction creation, you can analyze the data related to each service end point and this data is retained for the configured amount of time (based on logger system policy). You can create custom views of specific service end points related to a particular domain/container which are frequently viewed.

    Transactions
    Transactions are very useful when you have multiple components in the service interface like OSB, BPEL, Java, DB adapter calls etc. If there are service interactions which are asynchronous in nature, they can also be correlated using Message Fingerprint (a unique key identified by BTM), ECID or some custom message property to link them up. Transactions provide an end to end visibility on the service message flow through the various components and give analysis data like timings and fault details at individual message level if logging is enabled.

    SLA Policies/Alerts
    SLA policies can be defined on various service end points and email alerts triggered to the concerned stake holders if they are breached. Typical examples would be Avg. response time on a service exceeding a threshold value for a given period of time, Max response time for a service breaching some threshold, number of faults on a critical business service exceeding the high water mark etc.

    Based on my experience with the tool:
    • Out of the 5 JVM components in a typical BTM installation, the most important ones are the btmMonitor and btmMain. If the transaction load on servers are high, it would be recommended to horizontally scale the btmMonitor across cluster nodes, as its the one interacting with the Observers installed on all the monitored domains. btmPerformance and btmTransaction are other 2 JVMs...
    • I would say this is a very nice tool for technical people/developers and not something which would be used by Business users. The UI provides very detailed information at a granular level for each service transaction capturing information like throughput, Avg./Max response times, faults etc which can be very useful while doing performance testing of services.
    • The SLA alert emails are very helpful for support team while debugging production issues when end systems aren't responding in a timely fashion.
    • There is a BTM CLI (Command Line Interface) utility provided by the product which can be used to extract service/transaction information based on a time range. This can be used for reporting purposes for use cases like how many transactions ran for more than 30 seconds in a day for a specific service interface.
    • The underlying database tables of BTM is highly de-normalized (perhaps to optimize read performance and render data on the UI faster) but it makes it highly difficult to query specific data. It would be an understatement to say these DB tables are not straightforward to interpret.

    Tuesday, May 20, 2014

    Large Payload Handling In SOA

    There are several use-cases where Integration/Middleware layer is expected to handle large payload (XML/Non-XML) processing. There are many technical challenges with these kind of implementations:

    • How to process such large files (>1 GB) without running into Out Of Memory/Heap Space issues.
    • How to fine tune the design to ensure SLAs are met and data transformations are done efficiently without eating up server resources.
    Oracle has published several white papers and articles outlining the various use-cases where Oracle FMW/SOA Suite can be leveraged to process large payloads. These also cover the various best practices/configurations while designing/implementing such integrations.


    In this blog post I would cover one such use case of Processing large XML (with repeating structures). Requirement was to concurrently process more than 10 large sized XML files (each > 1GB). Oracle recommends using below approach for this use case:

    • De-batching XML
    • Chunked Read
    • Streaming XPath functions

    Steps followed:
    • For me requirement was to ensure input and output file have same sequence of data, so de-batching input XML wasn't an option as that would have generated different output files and merging those at end was a challenge. 
    • Created a BPEL and leveraged File Adapter's ChunkedRead operation. The approach was basically to  invoke read operation on file adapter inside while loop based on the chunk size configured. This will ensure that instead of loading the whole XML file into the memory, chunks of data will be loaded.    JCA : property name="ChunkSize" value="1000";
    • XSLT was be used on smaller payload size rather than the entire large payload. Used properties like streamResultToTempFile which enables XSLT results to be streamed to a temporary file and then loaded from the temporary file instead of caching into memory as a whole document in binary XML format (resulting in OOM errors)
    • Ensured proper JVM heap size settings (4-6 GB), transaction timeout settings (15-20 mins) and audit configurations are done at server level to avoid OOM errors.
    With the SOA approach I was able to successfully process only 1 to 2 large files of 1-1.5GB size concurrently. The time taken by BPEL was high (around 5 minutes for single file) and also the heap usage was very high. (XSLT was straight forward direct mapping for few fields only). This BPEL solution didn't scale up for concurrent processing of 3 or more files and started giving "Out Of Memory: Heap space" errors.

    Alternative Approach:

    With BPEL ruled out, the Plan "B" was to implement core processing logic in Java layer and invoke the java static method from OSB/BPEL using Java callout/Java embedding activities.

    Steps followed:
    • File streaming (read/write) was done using java.nio packages as these are faster and more efficient.
    • Method was implemented for file chunking i.e instead of reading and transforming the whole >1GB file, it was split into smaller chunks (4MB size) and processing was carried out each chunk (byte stream).
    • JAXB libraries were used for marshalling and unmarshalling of data and the transformation logic was embedded inside the java code itself.
    • Proper exception handling was implemented to reject bad records in any chunk of data and generate output data with only good data.
    Results:
    This alternative approach turned out to be a highly scalable solution and also helped in achieving the required SLAs with minimal heap usage.
    • Was able to process 10-12 such large files with less heap usage and in lesser time frame. (** Around 12 minutes for concurrently processing 12 such large files of 1GB size with overall heap usage of 1GB. Below is a JConsole screenshot after processing the files)
    • Load Balancing in Cluster environment was achieved by leveraging OSB Business Service's load balancing capability. This helped in distributing the file processing load across nodes of the cluster.

    Tuesday, October 29, 2013

    Integrating BAM with BPEL in SOA 11g

    Oracle Business Activity Monitoring (BAM) provides ability to create real time dashboards. BAM can act as a centralized monitoring framework across enterprise application integrations. It can pull data from critical points of the business process flow and display those KPIs in real time reports/alerts. With this post I would like to show how simple it is to integrate BAM with BPEL processes (won't get into step wise details for same as there are Tutorials available on OTN and web for the same) . There are 2 ways of integration BAM with BPEL in SOA 11g:

    •  Using BAM adapter 
    •  Using Sensor/Sensor Action inside BPEL.
    First and foremost login to your BAM console (http://hostname:port/OracleBAM ) and navigate to the BAM Architect to create the Data Object.


    Designing the data object is critical because that determines what exact fields we want to capture from BPEL and send it across to the BAM Active Data Cache.


    Next step is to navigate to the BAM Active Studio and create your real time report using the Data Object created above. Active Studio provides various report templates which you can incorporate to build interactive real time dashboards like Pie-Charts, Bar Graphs etc. Based on the requirement these can be designed.


    Once the report is ready and saved, next step is configuring the BAM adapter on the Weblogic Admin console of the SOA server where BPEL code runs (assuming BAM and SOA are running on different servers).

    On Admin console, navigate to Deployments-OracleBAMAdapter - Configuration - Outbound Connection 

    Pools and expand oracle.bam.adapter.adc.RMIConnectionFactory and click on eis/bam/rmi  (you can use your own JNDI name instead of using the default JNDI).


    Once saved, redeploy the BAM adapter for the changes to take effect.

    Next step is to move to Jdeveloper and open the BPEL code in the Monitor perspective. Create a BAM sensor variable and assign a sensor action to the same. Inside the orchestration flow you can assign appropriate values to the BAM sensor variable.


    BAM sensor action defines what kind of operation we want to perform. Here we are sending the data to the BAM Data Object created earlier (establish a connection to the BAM server from Jdeveloper to access the DO). The Mapper file maps elements from the BAM sensor variable to the Data Object fields.

    Once the code is deployed and BPEL instances are initiated you can navigate back to BAM console and click on Active Viewer - Select your report and watch it get updated in Real-Time with data sent from BPEL. Below is a sample custom report created based on the above Data Object.


    These reports have additional capabilities which can be enabled on them like Drill Down feature which lets you click on the Pie Chart/Bar graph and get additional details about that specific data set.

    Apart from these custom reports, BAM also ships with an Out-Of-The-Box report feature called Monitor Express which helps in real time composite instance monitoring. Single click enablement from Jdeveloper by switching to Monitor perspective of .bpel file and selecting Monitor Configuration from top left and selecting the specific mode we want to monitor. We can monitor scope level activities or entire BPEL level.

    The setup steps which need to be done from back end (BAM server) are :
    • Edit the SOA_HOME/bam/config/BAMICommandConfig.xml and set below 4 properties
    1. ICommand_Default_User_Name
    2. ICommand_Default_Password
    3. ADCServerName
    4. ADCServerPort
    • Next navigate to SOA_HOME/bam/samples/bam/monitorexpress/bin
    • Set JAVA_HOME and run the setup.sh. This script will load the required reports and data objects for the Monitor express dashboard.
    You should see something similar to below once this is enabled at runtime.It helps to find how many instances completed/faulted, average processing time of the composites, fault details etc.


    BAM is a very powerful and useful feature available from the Oracle SOA stack and can help in setting up Enterprise wide monitoring framework. Hope this post provides a basic understanding of how it can be easily implemented in SOA based integrations.